Portfolio
Sustainability research
Read key findings from indices produced at Tortoise Media and see charts for the Climate & Energy Benchmark report at World Benchmarking Alliance.
The Responsibility100 Index
The Better Food Index

Climate & Energy Benchmark
Weekly Charts
Browse my data vis short reads written for the Datawrapper blog.

How free is the global press?
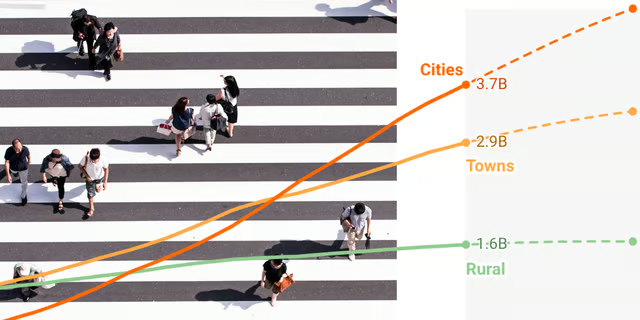
All the people who live in cities

Happy New Year!
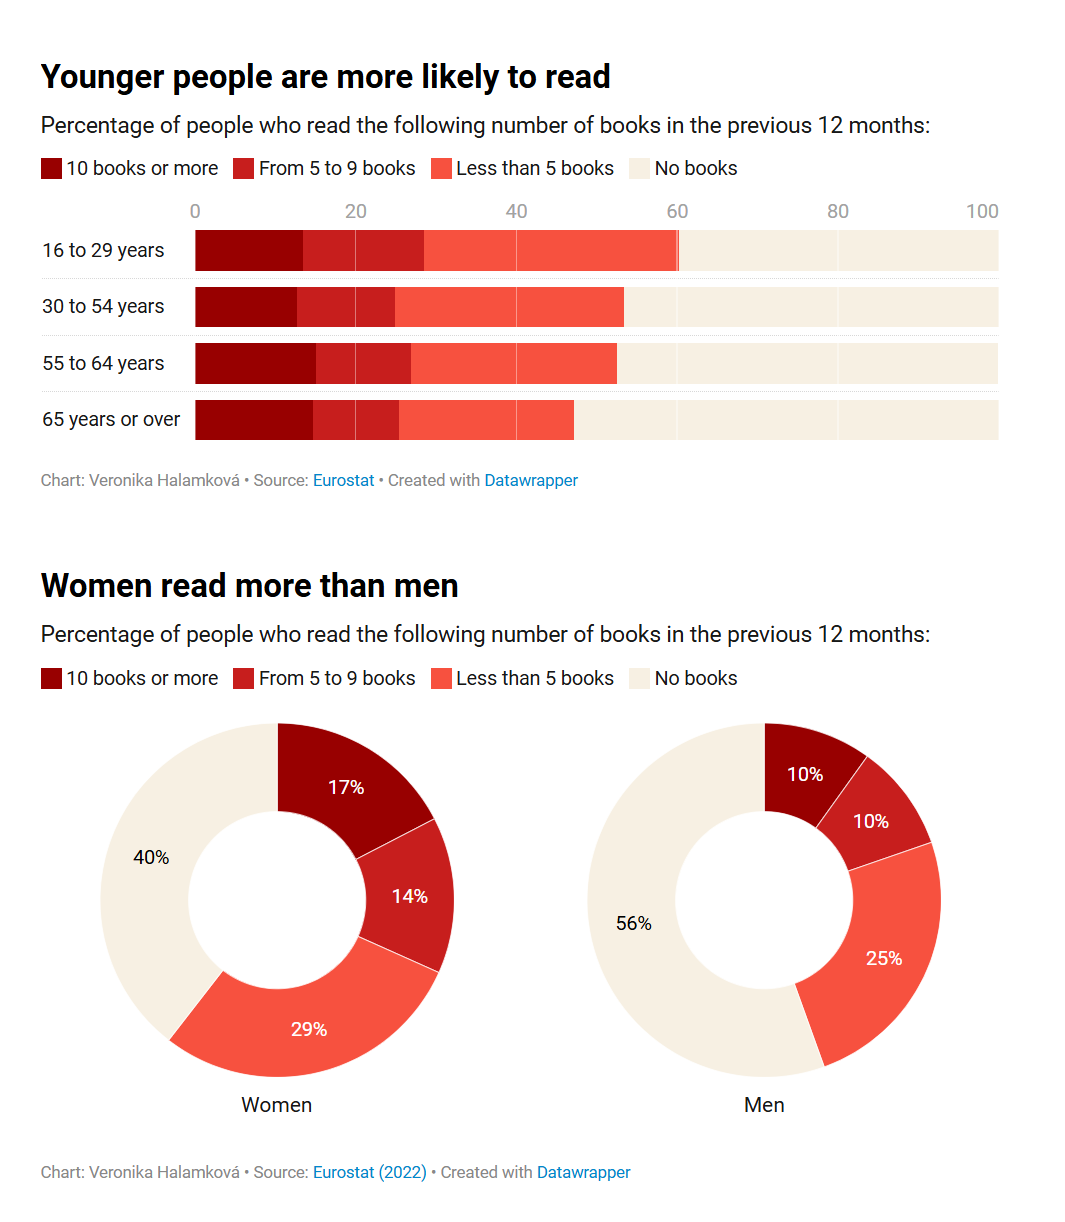
Europe's gender reading gap

How rare is sunshine in Berlin?
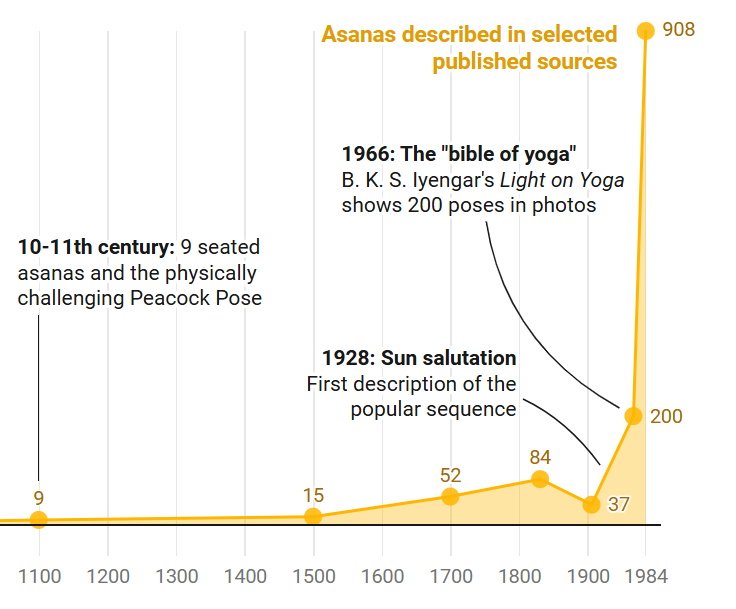
A very fuzzy history of yoga poses
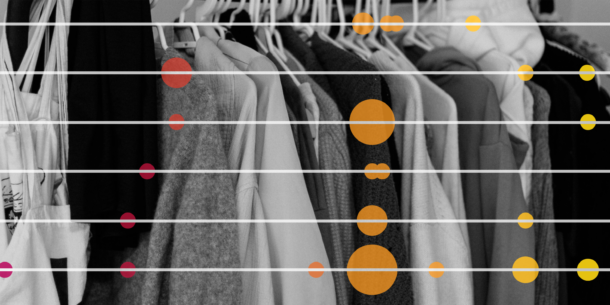
How transparent are my clothes?
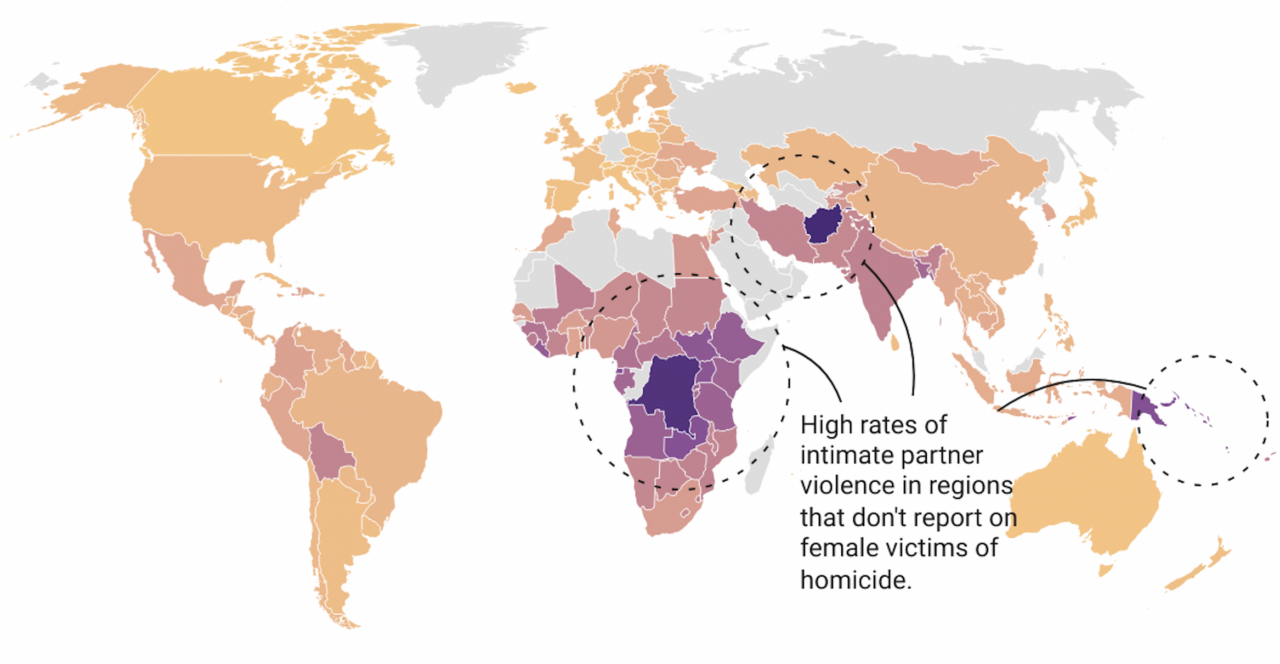
Women and hidden violence
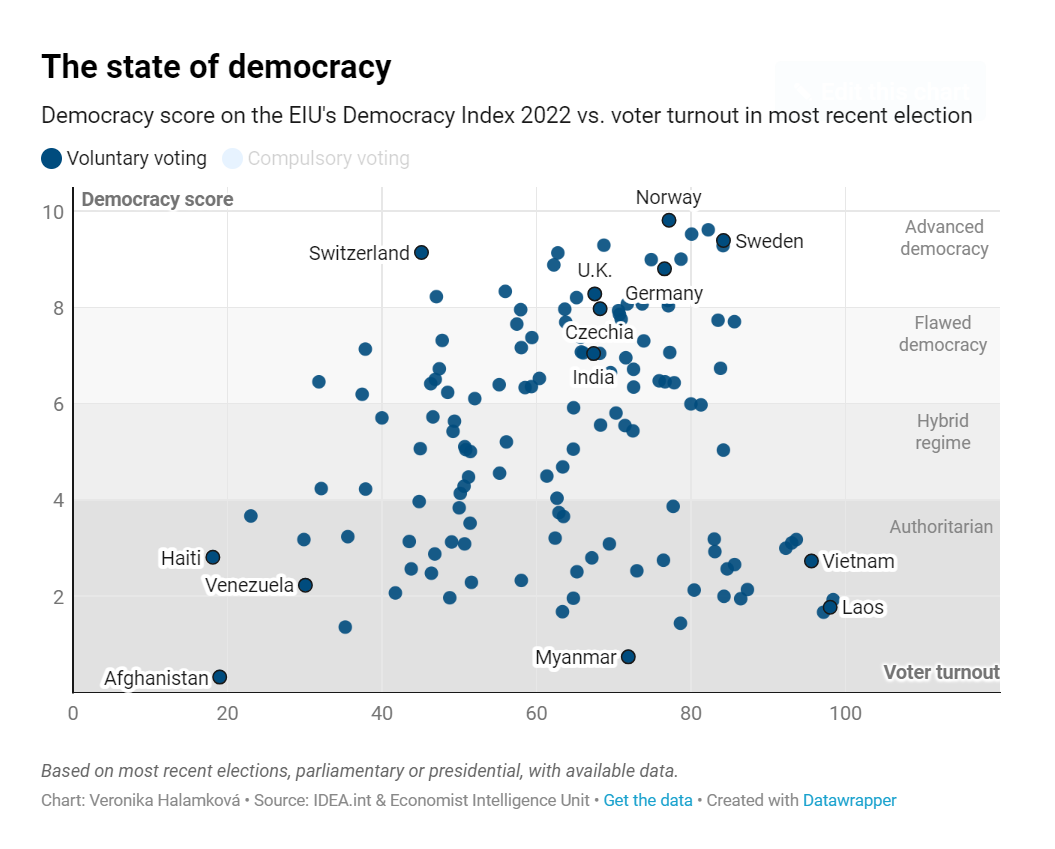
Do we use our right to vote?
Feature stories
Travel in time and space with features I wrote for The Echelon, a Sri Lankan business magazine, at the turn of 2017 and 2018.

Women and work: Why so few?
Women's empowerment as a sustainable business strategy

Why values matter and how to nurture them in business
Other data-driven projects & visualizations
Take a look at some of my encounters with data so far.
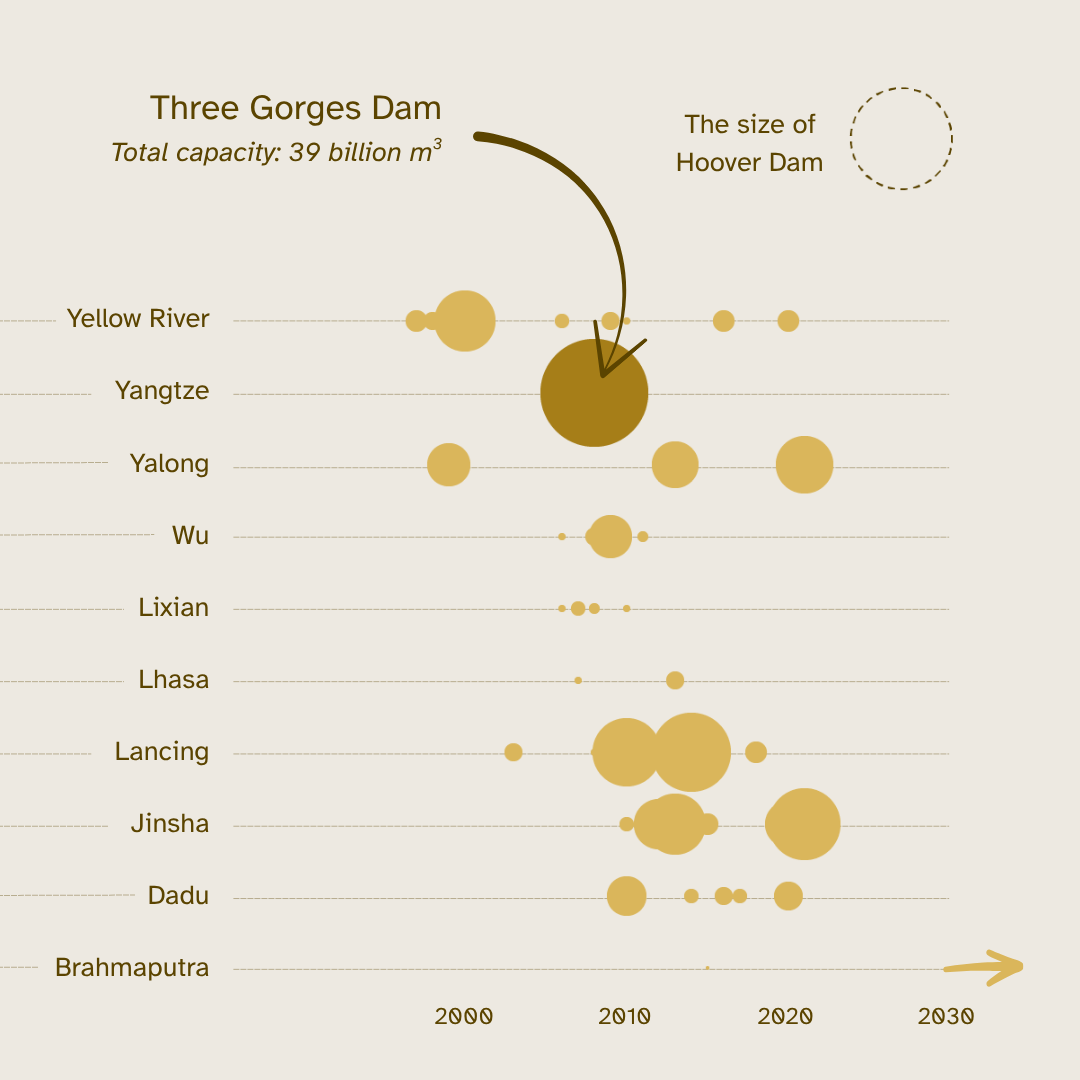
Charting change
(Substack)
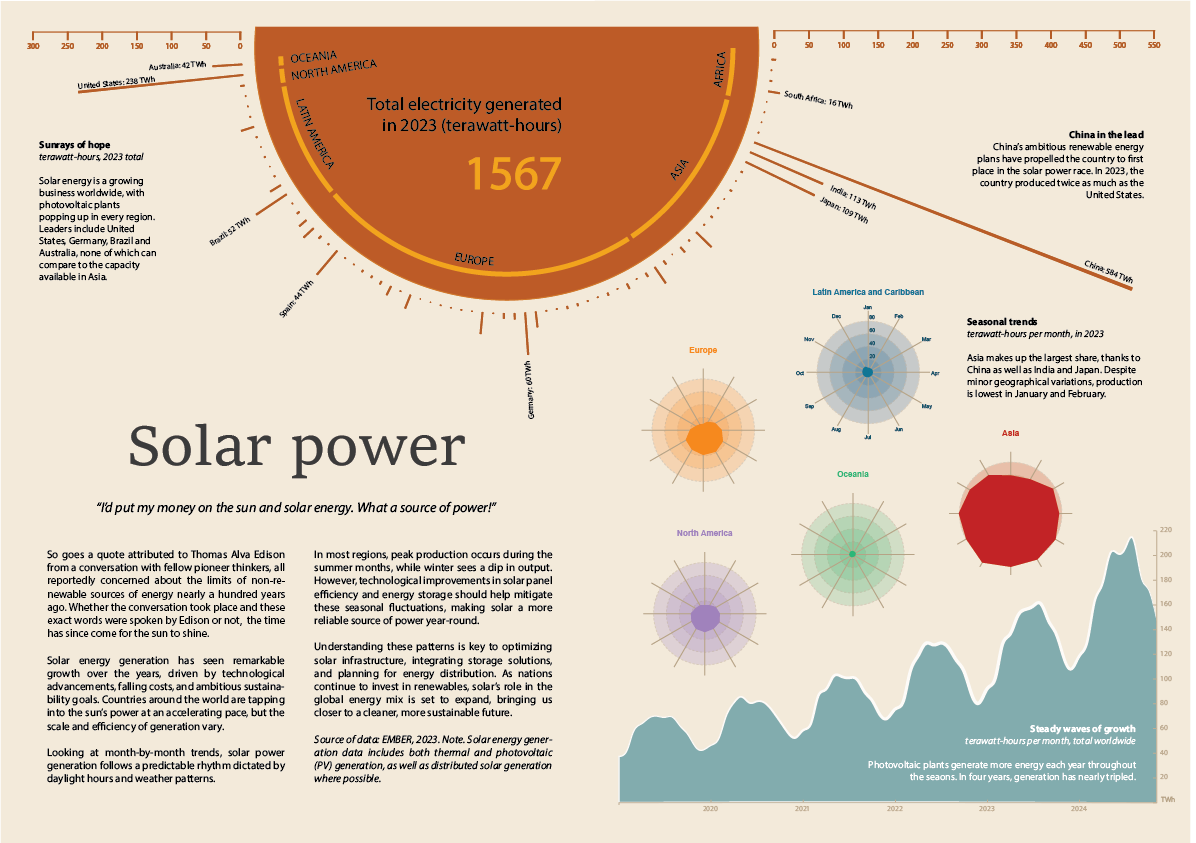
Solar power
(Adobe Illustrator)
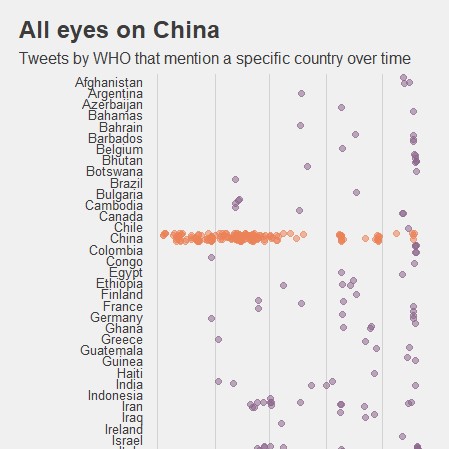
WHO tweets in the pandemic
(Python & R)
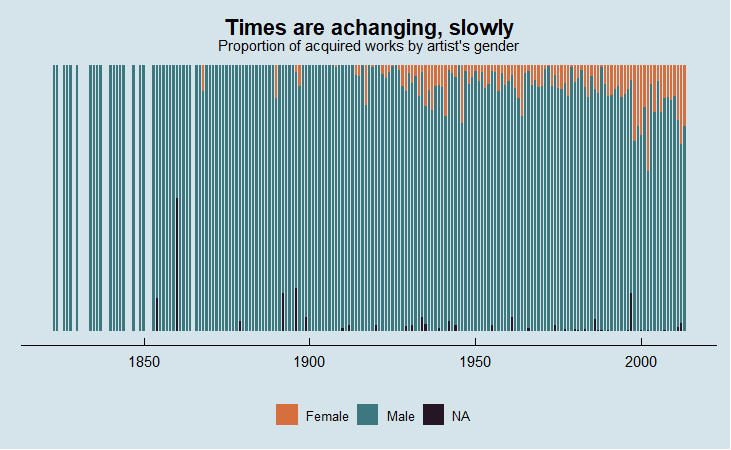
Gender representation of artists
at Tate (#tidytuesday)
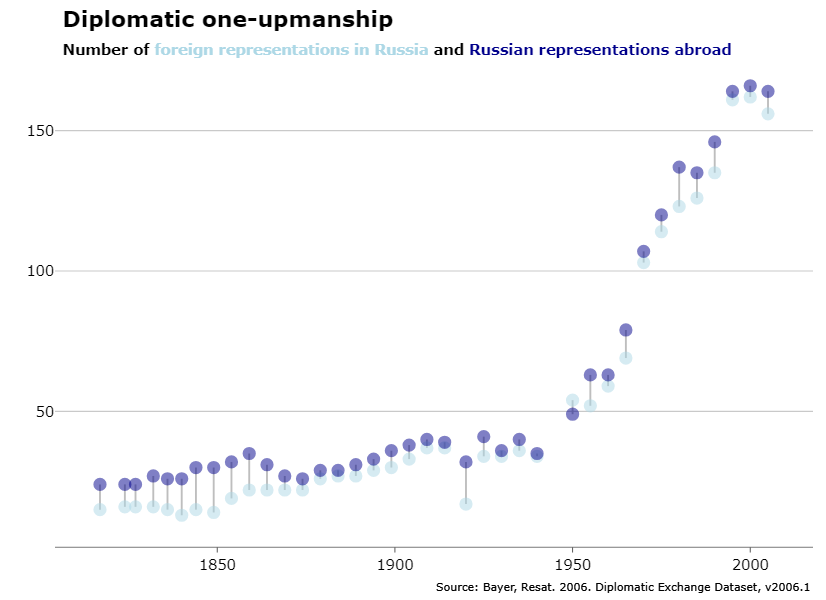
Russia's diplomatic one-upmanship
(R & Flourish)
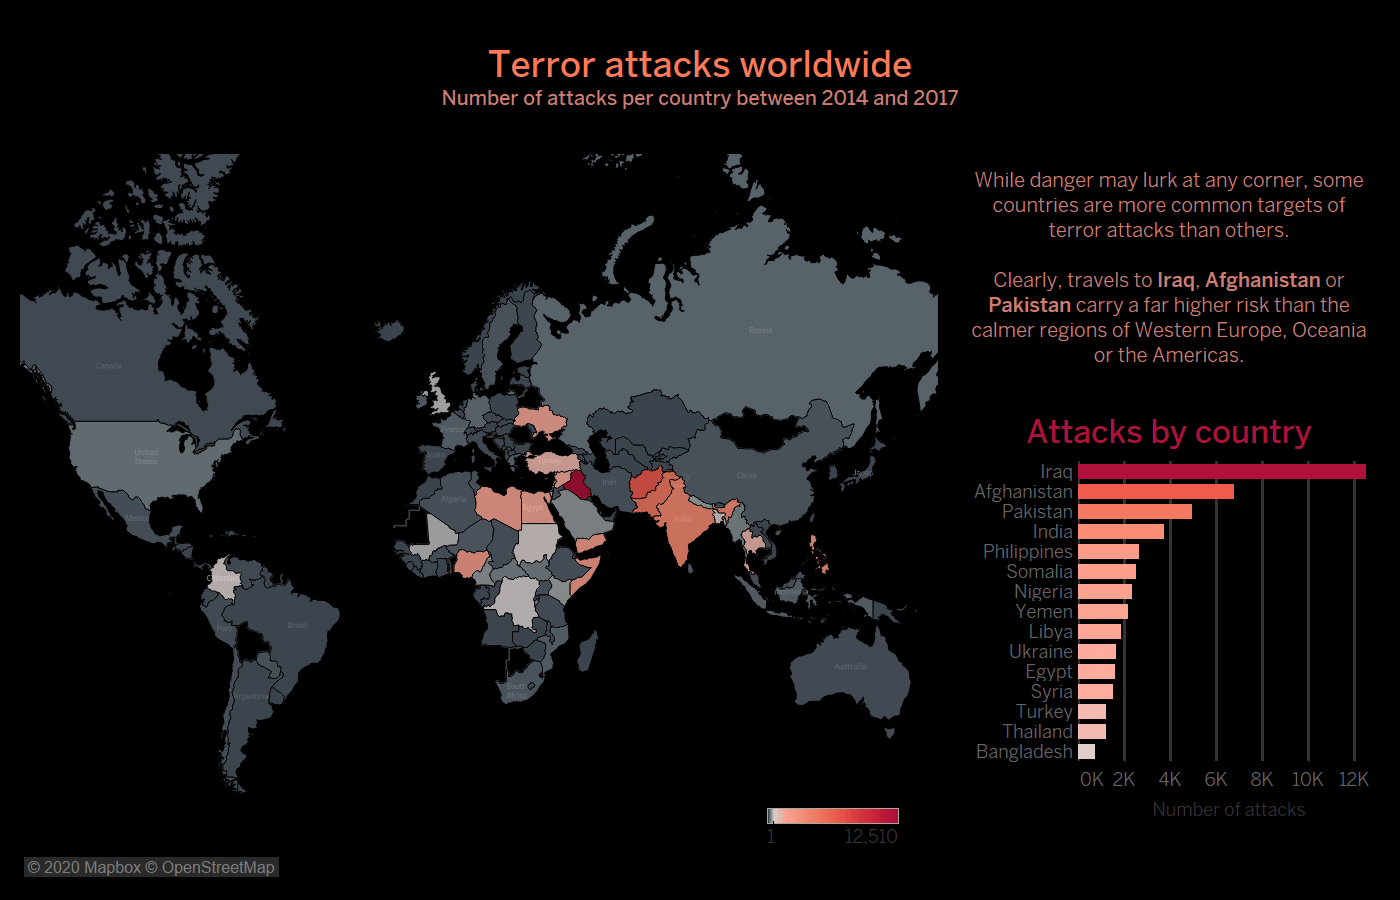
Terror attacks worldwide
(SQL & Tableau)